PRTG & Troubleshooting
The following is an example of using a couple technologies working together to alert on a potential network problem and then investigating the problem source.
PRTG and Firewall Real World Troubleshooting
PRTG helps immensely to alert and assist in the process (coupled with historical charts). Additional detail is provided via a PAN Palo Alto Networks application aware firewall.
NOTE: While not shown, I could have additionally used a traffic chart to visually confirm the traffic spike and known the duration.
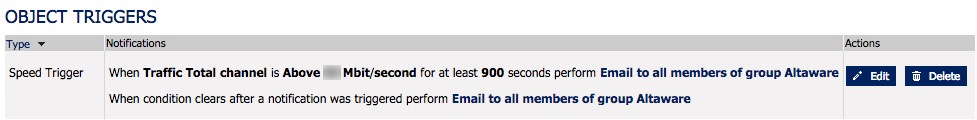
Result: From this we know that the circuit was busy for some period of time. We know the date/time, but not much else. Further investigation is warranted, but I prefer the system telling me versus getting a user complaint.
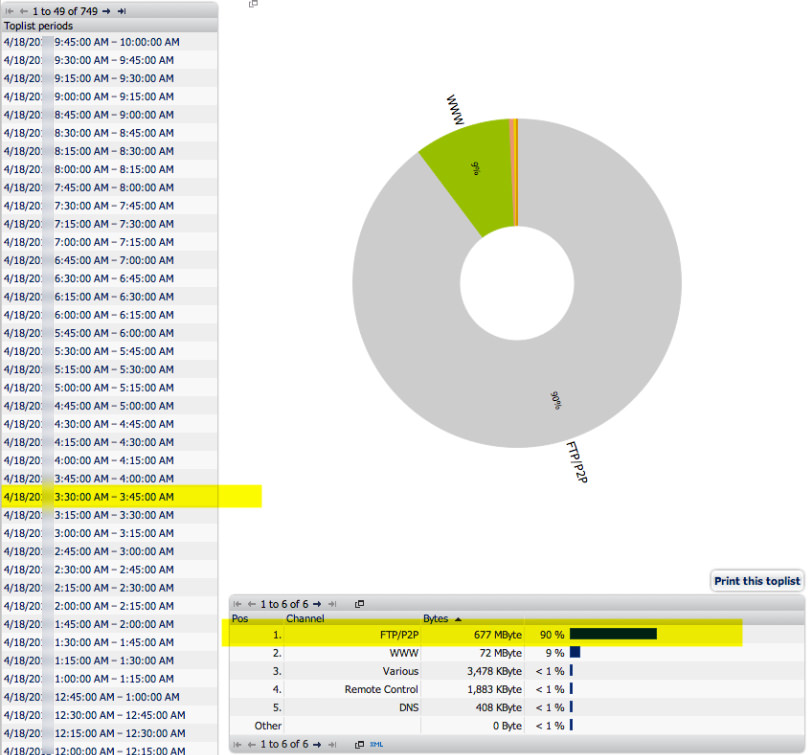
Flow data can show the source/destination IP addresses involved as well as the protocol. It's enough to potentially resolve the investigation. However, sometimes we need more.
Result: From this we know what type of protocol was involved and while not shown on the sample we would also know the source/destination address. That's good, but we don't yet know who as in user and we don't know a lot about the protocol.
NOTE: Network flow sensors are included with PRTG. You do need devices that can provide flow data to PRTG or use a span/mirror port.
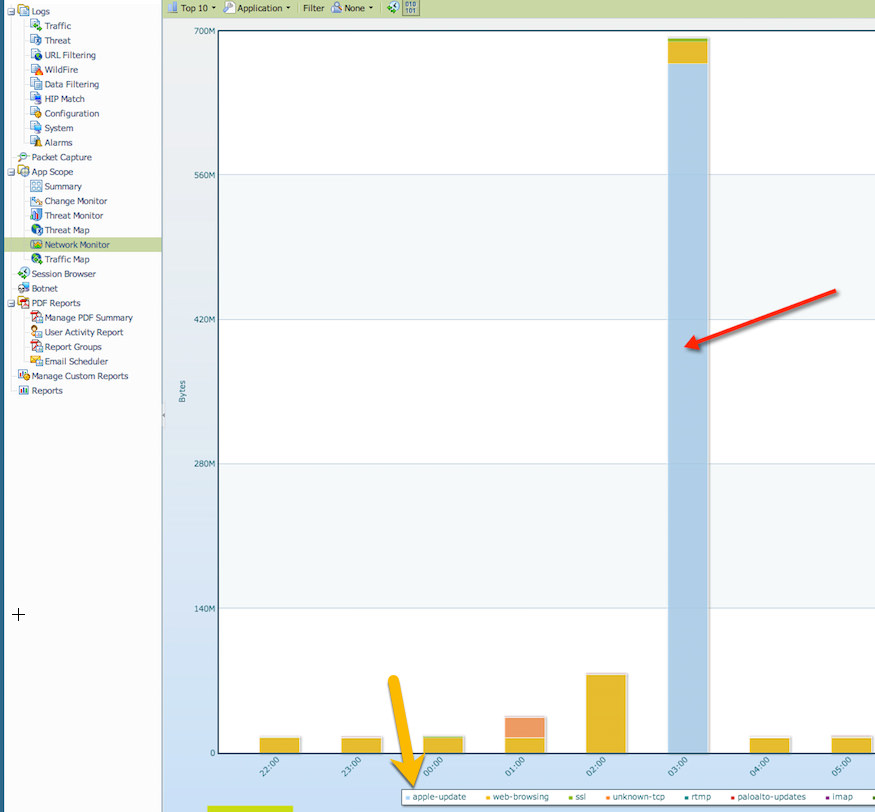
NOTE: While PRTG provided the bread crumbs, we're using a next generation firewall to get more information beyond general ip address, protocol and date/time. At this point, we're looking at internal tools to further compliment what PRTG has alerted us to.
Result: This is good, we have confirmation now on the firewall of the observed traffic. I'm starting to feel relieved as now I know it was an apple update that occurred on one of my servers during the early morning hours.
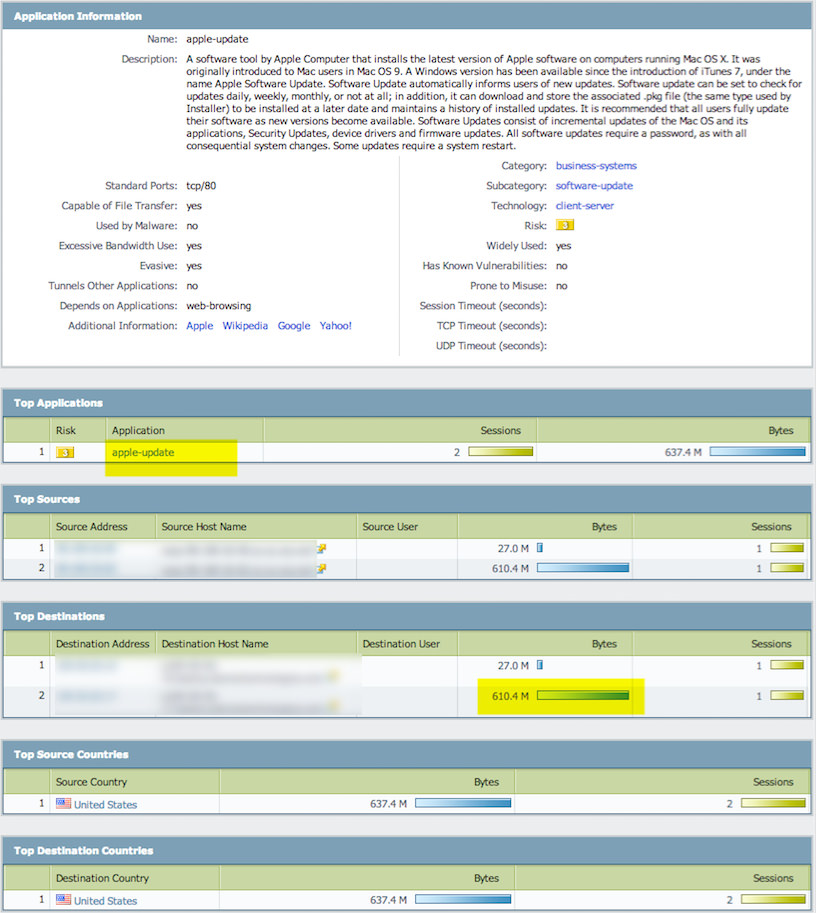
I can now feel confident this was legitimate traffic.
We went from getting an abnormal traffic alert to learning what device was involved, when it was involved, what application generated it along with where it went.
We can now close this incident.
Other PRTG Network Monitoring Sensors
SNMP Traffic - Use to display live total traffic, traffic in, traffic out and optionally errors. Great way to detect how "busy" a circuit is.
Ping - Used to detect network latency (delay) to a particular destination address. Great way to determine how responsive a circuit is based upon a single or multiple destination address tests. Yes, ping isn't a perfect way.
Jitter - Loosely stated the variance of ping latency, important metric for phone calls (audio).
http - Used to detect web site availability and/or responsiveness.
http advanced - Good way to detect download bandwidth, use with discretion.
hops/traceroute - Good way to detect routing changes that impact site responsiveness.
SNMP RMON - Used to detect part statistics, see sensor for more information.
Flow data - Supports Netflow (Cisco) and SFlow (Sampled Flow data). Great way to look at current or historical top talking IP addresses and/or protocols.
It can show the following:
- Traffic in
- Traffic out
- Traffic total
- Errors in and out
- Discards in and out
- Unicast packets in and out
- Non unicast packets in and out
- Multicast packets in and out
- Broadcast packets in and out
- Unknown protocols
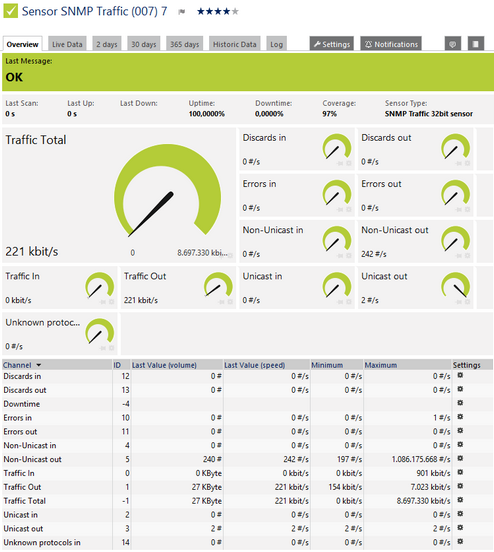
SNMP Traffic Sensor
Click here to enlarge: http://media.paessler.com/prtg-screenshots/snmp_traffic.png
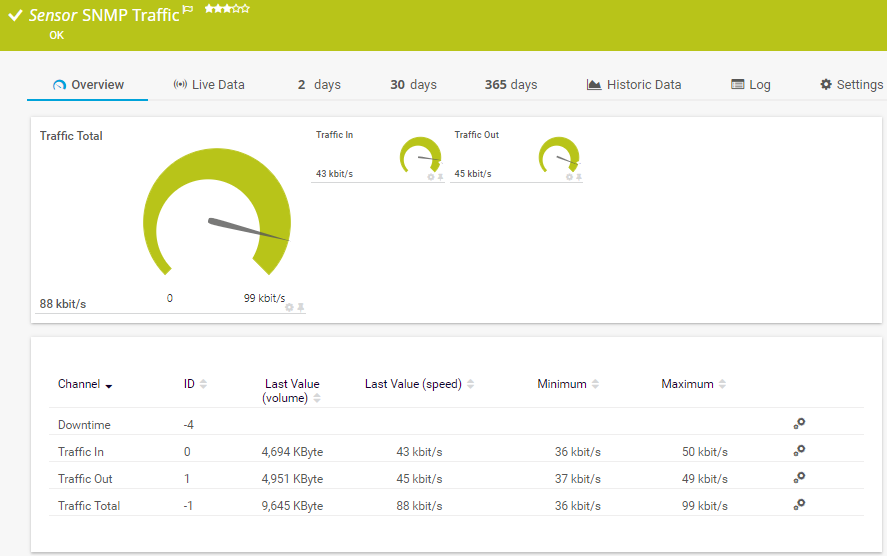
For each port, the sensor can show, for example:
- Transmitted kbit/s
- Packets (#/s)
- Broadcast Packets (#/s)
- Multicast Packets (#/s)
- CRC Errors (#/s)
- Undersize Packets (#/s)
- Oversize Packets (#/s)
- Fragments (#/s)
- Jabbers (#/s)
- Collisions (#/s)
- Packets <= 64 Byte (#/s)
- Packets 65 - 127 Bytes (#/s)
- Packets 128 - 255 Bytes (#/s)
- Packets 256 - 511 Bytes (#/s)
- Packets 512 - 1023 Bytes (#/s)
- Packets 1024 - 1518 Bytes (#/s)
- Drop Events (#/s)
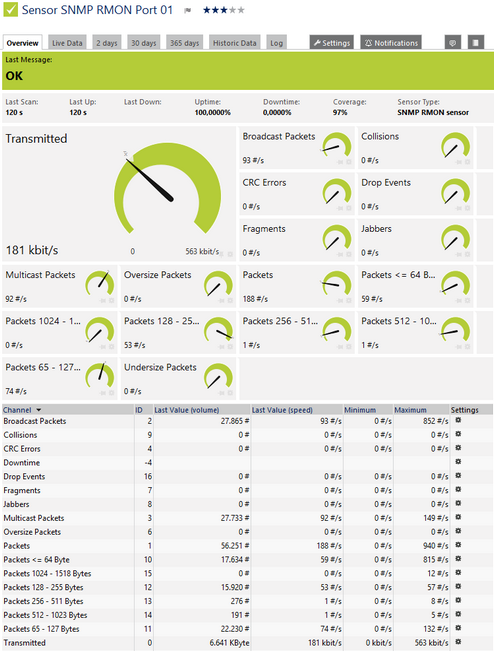
SNMP RMON Sensor
Click here to enlarge: http://media.paessler.com/prtg-screenshots/snmp_rmon.png
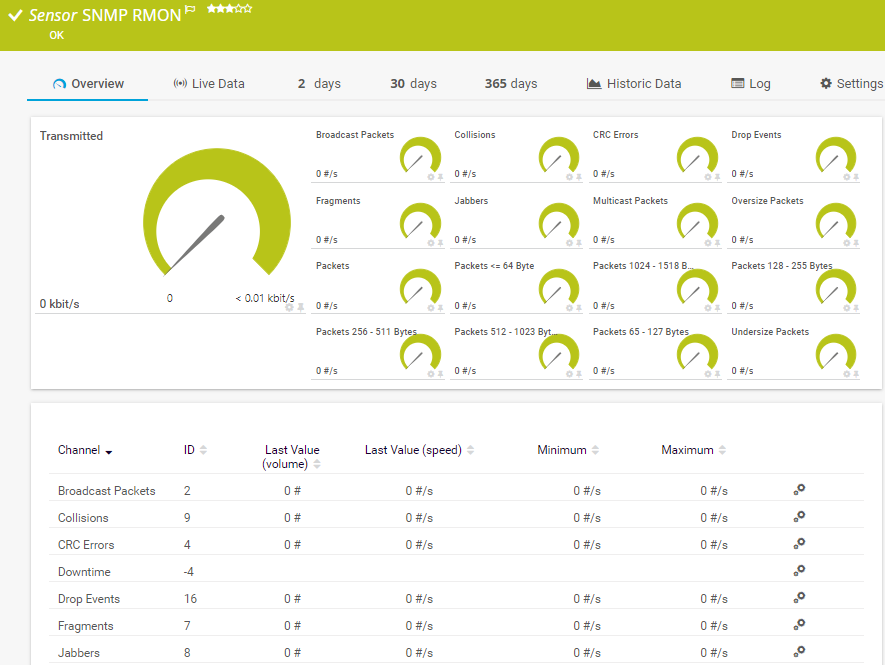
This sensor can show the following traffic types in kbit per second:
- Chat (IRC, AIM)
- Citrix
- FTP/P2P (file transfer)
- Infrastructure (network services: DHCP, DNS, Ident, ICMP, SNMP)
- Mail (mail traffic: IMAP, POP3, SMTP)
- NetBIOS
- Remote control (RDP, SSH, Telnet, VNC)
- WWW (web traffic: HTTP, HTTPS)
- Total traffic
- Other protocols (other UDP and TCP traffic)
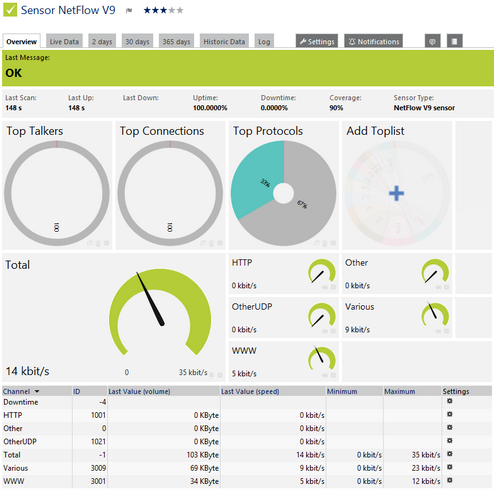
NetFlow V9 Sensor
Click here to enlarge: http://media.paessler.com/prtg-screenshots/netflow_v9.png
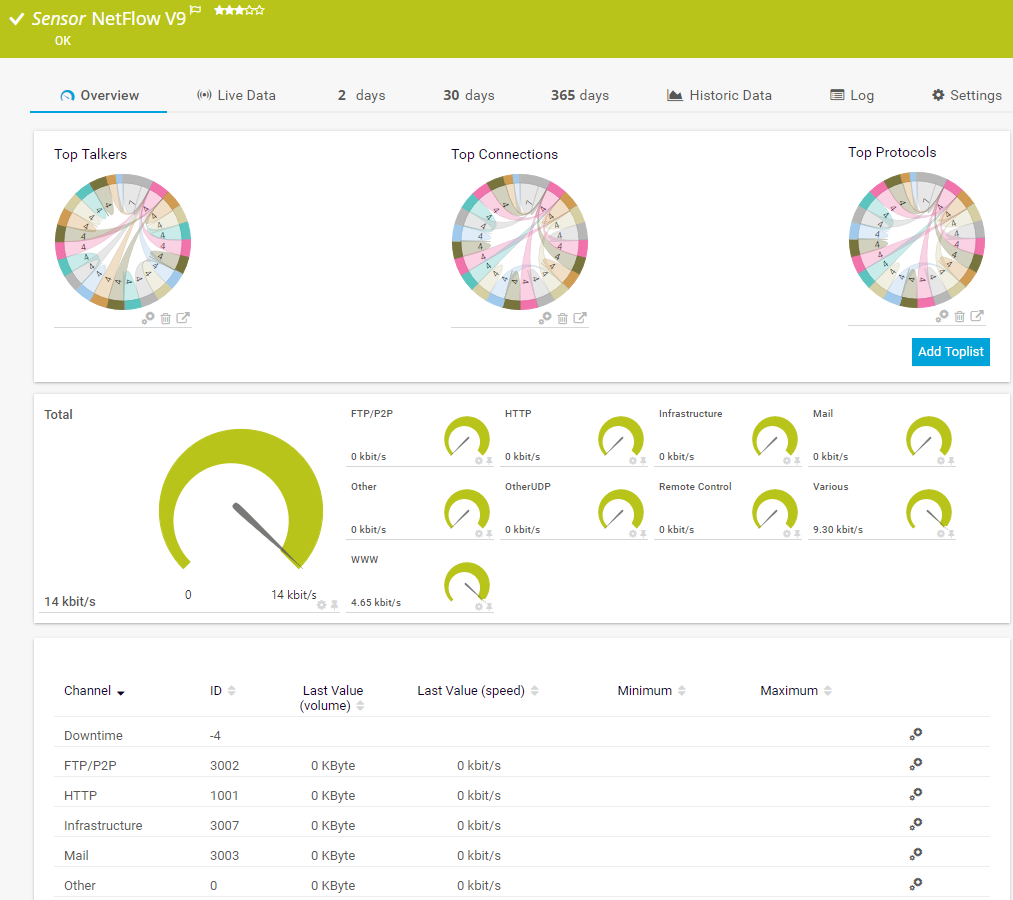
It can show the following:
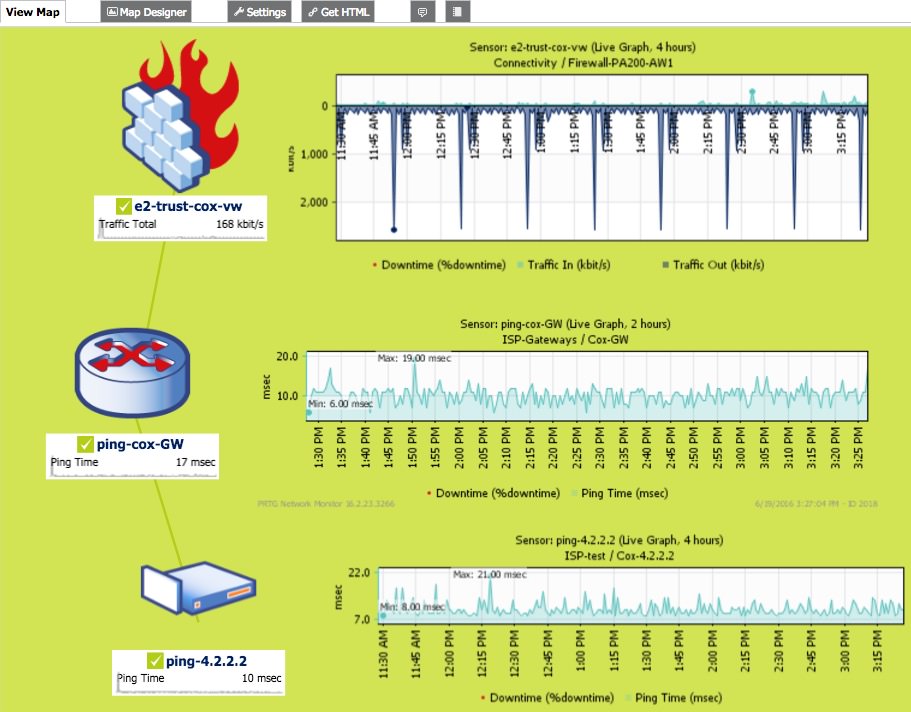
- Ping time
- Minimum ping time when using more than one ping per interval
- Maximum ping time when using more than one ping per interval
- Packet loss in percent when using more than one ping per interval
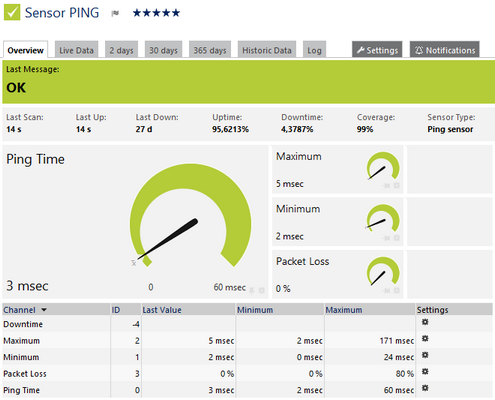
Ping Sensor
Click here to enlarge: http://media.paessler.com/prtg-screenshots/ping.png
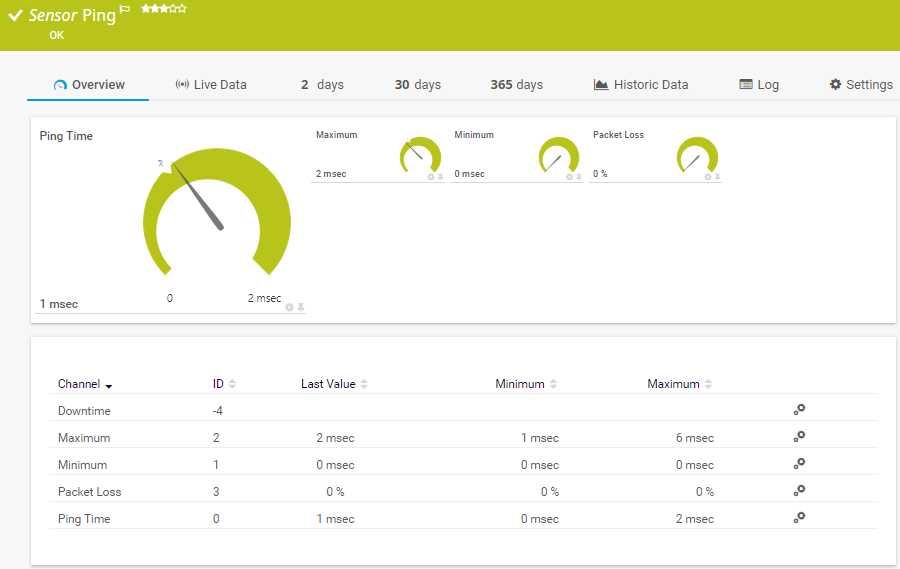
This sensor shows the following:
- Statistical jitter value
- Execution time
Jitter = Jitter + ( abs( ElapsedTime – OldElapsedTime ) – Jitter ) / 16
The Statistical Jitter value is calculated on the first x packets received using the statistical variance formula:
Jitter Statistical = SquareRootOf( SumOf( ( ElapsedTime[i] – Average) ^ 2 ) / ( ReceivedPacketCount – 1 ) )
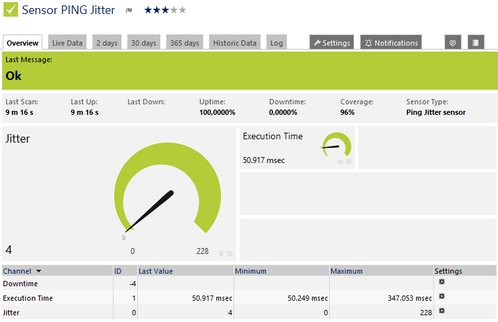
Ping Jitter Sensor
Click here to enlarge: http://media.paessler.com/prtg-screenshots/ping_jitter.png
QoS - Quality of Service
Traceroute - To determine hop count to a destination
http advanced - To determine download bandwidth (use with caution)
Syslog receiver - Not to replace syslog, but log for existence or not of certain messages
Other customer SNMP:
- Firewall examples: Sessions
About Us | Contact Us | Privacy Policy | EOL
© 2023 Altaware, Inc. | All rights reserved.
949-468-0020
CYBER SECURITY skills in ORANGE COUNTY, CA
Remote cyber security skills/services within the USA